|
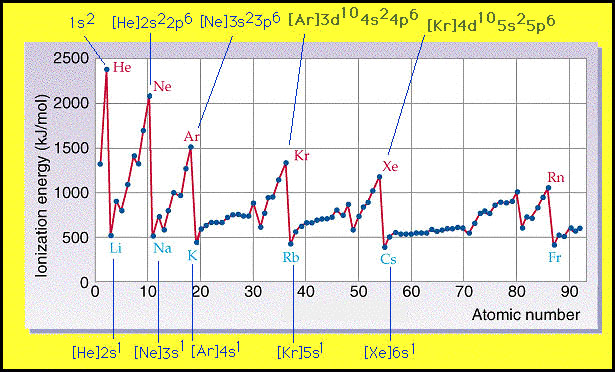
Clearly, the most striking feature of this graph is that there
is an inherent periodicity. How can this periodicity be explained?
If we examine the electronic configurations of these elements
we find that all elements with the lowest ionization energies
-the alkali metals - have similar electronic configurations -
[NG]ns2. Similarly, all the elements with the largest ionization
energies - the noble gases- have filled s and p electronic configurations
- [NG](nd10)ns2np6. The elements inbetween these two extremes
also have similar electronic configurations.
Therefore, the periodicity of the data in the graph is a direct
result of the underlying periodicity in the electronic configuration
of the elements.
|


